

<<
Over the past 30 years, hard drives have been the backbone of data storage. No one doubts their critical role in a computer system. Hard drives typically store users’ most important information, and given our heavy reliance on them, everyone invariably cares about one crucial question: How long does a hard drive actually last?
The common saying is that the theoretical lifespan of a mechanical hard drive is over 30,000 hours. A drive running continuously (like a web server’s hard drive) is generally expected to fail within 3 years. Under normal usage, 6 to 7 years should be no problem. However, no one had conducted a theoretical analysis on hard drive longevity, nor had similar research findings been published, until recently. A company named Backblaze released a report analyzing hard drive lifespan through a large dataset. Backblaze is an online backup service provider that has been in business for over five years. With more than 25,000 hard drives currently spinning, they now have sufficient data to calculate hard drive longevity.
It should be noted that these drives are all running 24×7 non-stop and are configured in RAID arrays. However, they use ordinary consumer-grade products rather than enterprise or surveillance-grade drives, relying solely on software redundancy to protect data. Therefore, the statistics in this article represent the performance of drives under continuous operation. For the average user’s lifespan estimate, you should at least multiply this by 3 (equivalent to running 8 hours a day).
Before diving in, let’s first explain failure rates. You might think a 100% failure rate is the worst-case scenario, but that’s a big mistake. Suppose you have 100 hard drives that are very reliable, but then suddenly all of them die after half a year. What would the annual failure rate be? In this case, you’d need to replace the entire batch twice a year, meaning you need 200 new drives, hence an annual failure rate of 200%.
What if one drive fails every hour? The annual failure rate would be 876,000%!
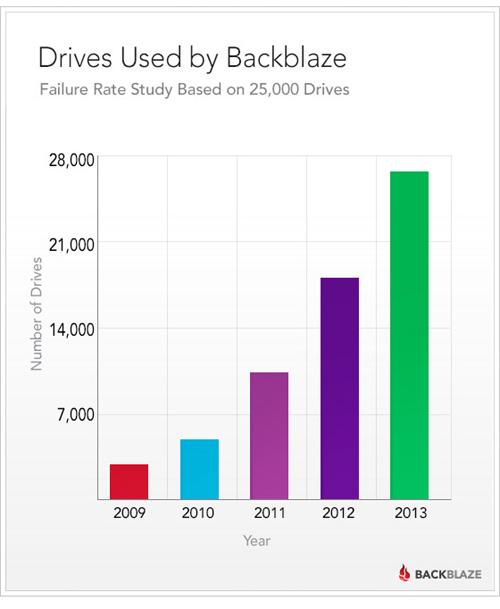
Number of Hard Drives Used by Backblaze Over the Years
Bathtub Curve: Engineers use this term to describe the change in the expected failure rate of a product over time. The bathtub curve represents the regularity of reliability changes throughout a product’s entire life cycle, from commissioning to scrapping. Practice has proven that the failure rates of most equipment follow the bathtub curve, which is high at both ends and low in the middle, with distinct phases that can be divided into three stages: the early failure period, the random failure period, and the wear-out failure period.
Generally speaking, product failures come from three sources: 1. Factory defects, which almost always lead to quick product failure; 2. Random failures, which are basically stable; 3. Component wear-out failures, which become more frequent the longer the usage time.
Combining these three elements forms a bathtub curve.
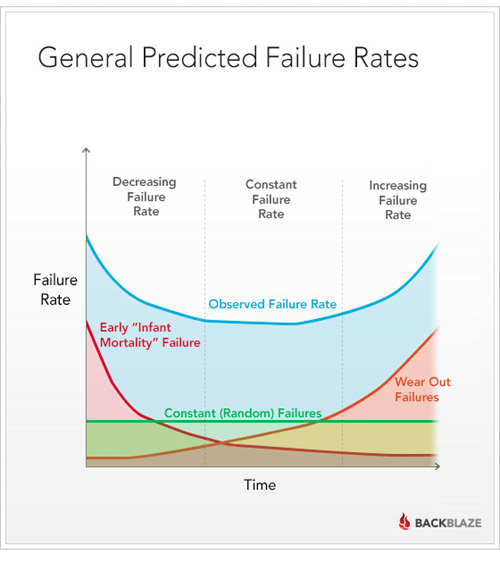
Hard Drive Failures Match the Bathtub Curve
Theory and reality match up very well. Here is Backblaze’s quarterly hard drive failure rate statistics:
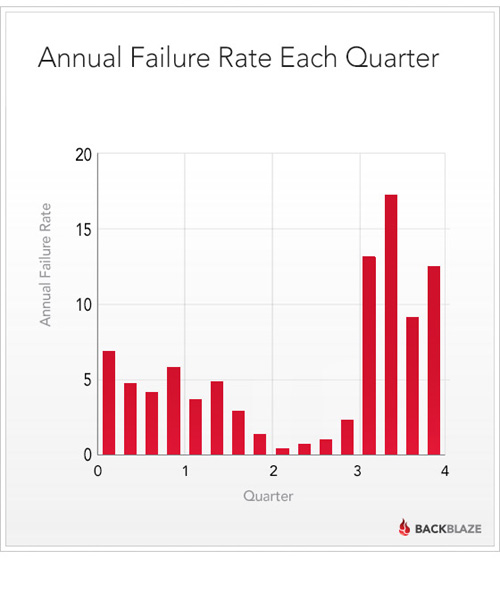
Hard Drive Failure Rates in the First Four Years
In the first 18 months (six quarters), the failure rate hovered around 5%. It then dropped significantly over the following year before increasing sharply as drives entered their third year, reaching 10-15%.
This indicates that if a hard drive runs continuously, there is a high probability of encountering problems after three years.
Average Life Expectancy:
You often hear the term “average human life expectancy,” but you may not fully understand what it represents. If the average life expectancy of newborns globally in 2010 was 67.2 years, then after about a century, when all those individuals have passed away, their average age of death will be 67.2 years. Of course, some may die shortly after birth, while others may live to 130.
The same logic applies to hard drives.
Hard Drive Survival Rate:
Backblaze’s statistics on their own drives revealed the following:
- In the first year and a half, 5.1% of drives die annually.
- In the next year and a half, this rate drops to just about 1.4%.
- Over the subsequent three years, the failure rate jumps to 11.8%.
Subtracting these casualties, the proportion remaining in the total is the hard drive survival rate.
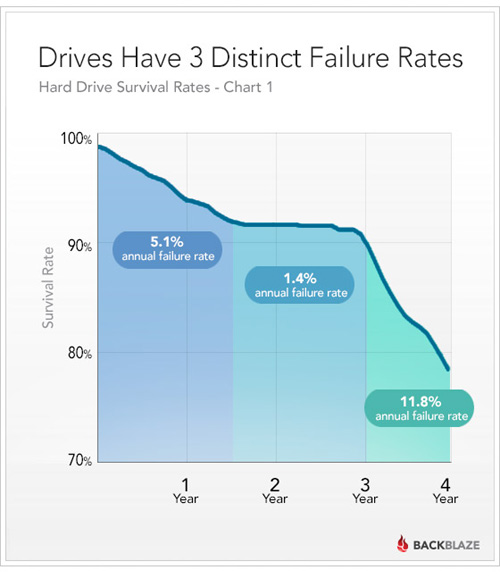
Hard Drive Failure Rates in the First Four Years
Looking solely at the chart above can be misleading, as it might seem like drives are about to become completely unusable very quickly. However, note that the starting point of the Y-axis for survival rate is 70%. If we change the baseline to 0, it looks like this: