

I. Nagios Introduction

Nagios is an open-source computer system and network monitoring tool that can effectively monitor the status of Windows, Linux, and Unix hosts, network devices such as switches and routers, printers, and more. It sends email or SMS alerts immediately when system or service anomalies occur, notifying website operations personnel, and sends normal recovery notifications when the state is restored.
Nagios was originally named NetSaint, developed and maintained by Ethan Galstad. NAGIOS is an acronym: “Nagios Ain’t Gonna Insist On Sainthood” — Sainthood translates to 圣徒, and “Agios” is the Greek word for “saint.” Nagios was developed for use on Linux but also works very well on Unix.
Key Features
- Network service monitoring (SMTP, POP3, HTTP, NNTP, ICMP, SNMP, FTP, SSH)
- Host resource monitoring (CPU load, disk usage, system logs), including Windows hosts (using NSClient++ plugin)
- Custom plugins can be written to monitor any condition by collecting data over the network (temperature, alerts, etc.)
- Remote execution of plugins can be configured via Nagios for remote script execution
- Remote monitoring supports SSH or SSL encrypted tunnel methods
- Simple plugin design allows users to easily develop their own check services, supporting many development languages (shell scripts, C++, Perl, Ruby, Python, PHP, C#, etc.)
- Includes many graphical data plugins (Nagiosgraph, Nagiosgrapher, PNP4Nagios, etc.)
- Supports parallel service checks
- Can define network host hierarchy, allowing tiered checks starting from parent hosts downward
- Sends notifications when services or hosts encounter issues, via email, pager, SMS, or any user-defined custom plugin
- Custom event handling mechanisms can be defined to reactivate problematic services or hosts
- Automatic log rotation
- Supports redundant monitoring
- Includes a web interface to view current network status, notifications, problem history, log files, etc.
II. How Nagios Works
Nagios is designed to monitor services and hosts, but it does not include this functionality itself — all monitoring and detection features are implemented through various plugins.
After starting Nagios, it periodically and automatically invokes plugins to check server status. Meanwhile, Nagios maintains a queue where all status information returned by plugins is placed. Nagios reads information from the front of the queue each time, processes it, and displays the status results via the web interface.
Nagios provides many plugins that make it easy to monitor various service statuses. After installation, all included plugins can be found in the /libexec directory under the Nagios home directory — for example, check_disk checks disk space, check_load checks CPU load, and so on. Each plugin can be run with ./check_xxx –help to view its usage and functionality.
Nagios recognizes four types of return status codes: 0 (OK) — normal/green, 1 (WARNING) — warning/yellow, 2 (CRITICAL) — very severe error/red, and 3 (UNKNOWN) — unknown error/deep yellow. Nagios determines the monitored object’s status based on the plugin return values and displays them via the web interface for administrators to promptly detect failures.
Four Monitoring States

As for the alerting functionality — if a monitoring system detects problems but cannot send alerts, it is meaningless. Therefore, alerting is also one of Nagios’s very important features. However, similarly, Nagios itself has no alerting code, or even plugins — this is left to users or related open-source project teams to implement.
Nagios installation refers to the base platform, namely the installation of the Nagios software package. It is the framework of the monitoring system and the foundation of all monitoring.
When opening the official Nagios documentation, you will find that Nagios has essentially no dependencies, only requiring the system to be Linux or another Nagios-supported system. However, if you have not installed Apache (HTTP service), you will not have such an intuitive interface to view monitoring information, so Apache can be considered a prerequisite. There are many guides online for Apache installation — just follow them. After installation, check that it works properly.
Now that we know how Nagios manages server objects through plugins, let’s look at how it manages remote server objects. The Nagios system provides a plugin called NRPE. Nagios periodically runs it to obtain various status information from remote servers. The relationship between them is shown in the diagram below:
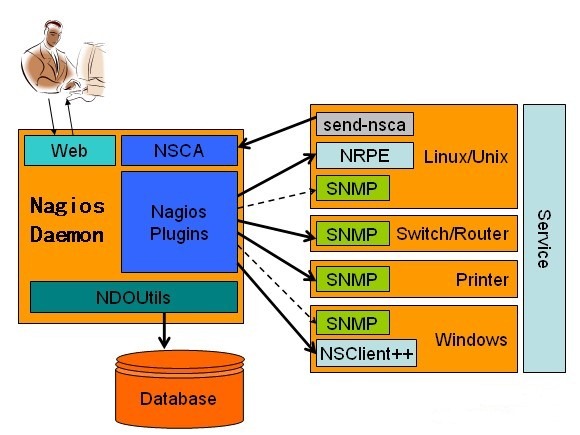
Nagios uses NRPE for remote service management
1. Nagios executes the check_nrpe plugin installed within it and tells check_nrpe which services to check.
2. Via SSL, check_nrpe connects to the NRPE daemon on the remote machine.
3. NRPE runs various local plugins to check local services and status (check_disk, etc.)
4. Finally, NRPE sends the check results back to the host-side check_nrpe, which then passes the results into the Nagios status queue.
5. Nagios reads information from the queue sequentially and displays the results.
III. Lab Environment
| Host Name | OS | IP | Software |
| Nagios-Server | CentOS release 6.3 (Final) | 192.168.1.108 | Apache, PHP, Nagios, nagios-plugins |
| Nagios-Linux | CentOS release 5.8 (Final) | 192.168.1.111 | nagios-plugins, NRPE |
| Nagios-Windows | Windows XP | 192.168.1.113 | NSClient++ |
The Server has Nagios software installed to process monitoring data and provide a web interface for viewing and management. It can of course also monitor its own local information.
The Client has NRPE and other client software installed, executing monitoring tasks at the request of the monitoring machine and returning results to the monitoring machine.
Firewall is disabled / iptables: Firewall is not running.
SELINUX=disabled
IV. Lab Objectives
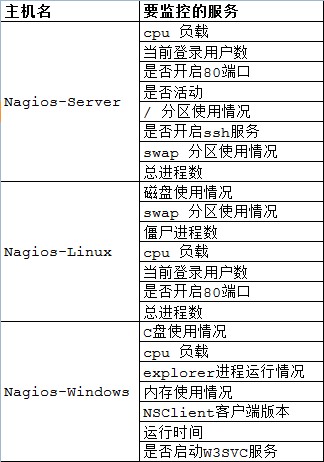
V. Nagios Server Installation
5.1 Base Support Packages: gcc glibc glibc-common gd gd-devel xinetd openssl-devel
# rpm -q gcc glibc glibc-common gd gd-devel xinetd openssl-devel

If these packages are not present in the system, install them using yum
# yum install -y gcc glibc glibc-common gd gd-devel xinetd openssl-devel
5.2 Create nagios user and user group
# useradd -s /sbin/nologin nagios# mkdir /usr/local/nagios# chown -R nagios.nagios /usr/local/nagios

Check the nagios directory permissions
# ll -d /usr/local/nagios/

5.3 Compile and Install Nagios
# wget http://prdownloads.sourceforge.net/sourceforge/nagios/nagios-3.4.3.tar.gz
# tar zxvf nagios-3.4.3.tar.gz
# cd nagios
# ./configure –prefix=/usr/local/nagios

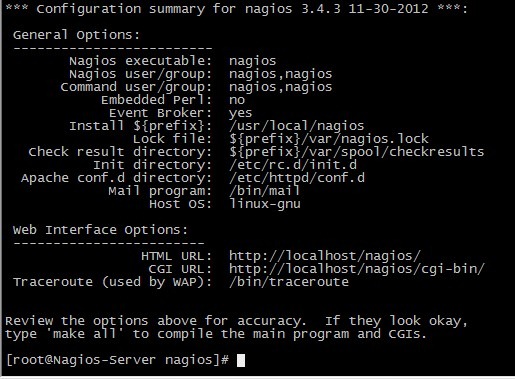
# make all
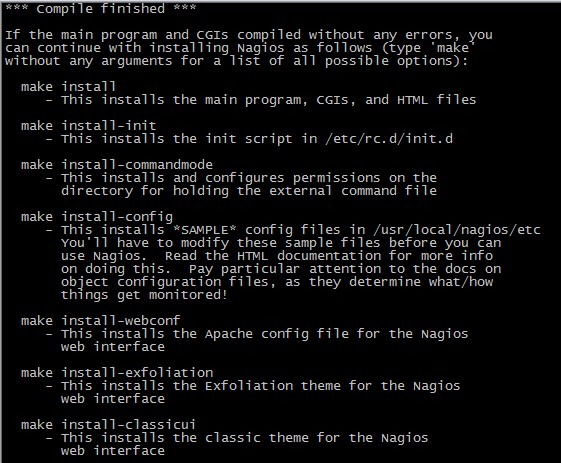
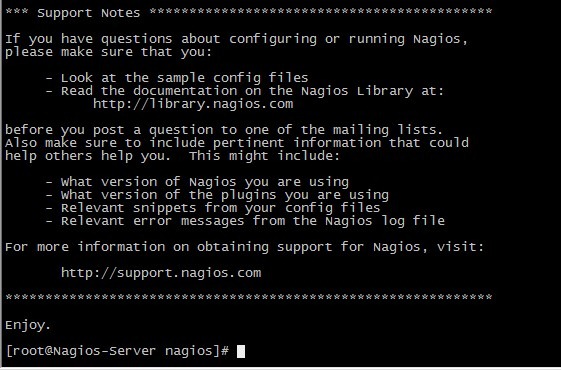
# make install
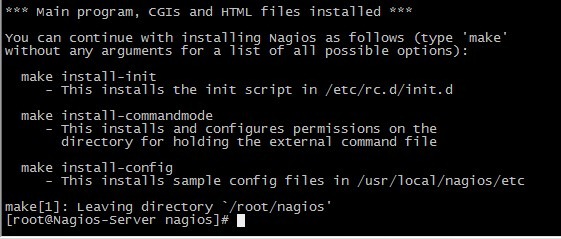
# make install-init

# make install-commandmode

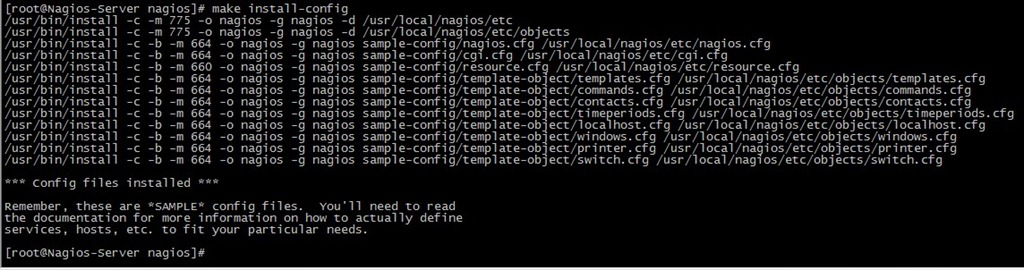
# make install-config
# chkconfig –add nagios
# chkconfig –level 35 nagios on
# chkconfig –list nagios

5.4 Verify the program was installed correctly
Change to the installation directory (here /usr/local/nagios) and check whether the five directories — etc, bin, sbin, share, var — exist. If they do, it indicates that the program has been correctly installed. The purpose of each Nagios directory is described below:
| bin | Directory containing Nagios executable programs |
| etc | Directory containing Nagios configuration files |
| sbin | Directory containing Nagios CGI files, i.e., files required for executing external commands |
| share | Directory containing Nagios web page files |
| libexec | Directory containing Nagios external plugins |
| var | Directory containing Nagios log files, lock files, etc. |
| var/archives | Nagios automatic log archive directory |
| var/rw | Directory used to store external command files |
5.5 Install Nagios Plugins
# wget http://prdownloads.sourceforge.net/sourceforge/nagiosplug/nagios-plugins-1.4.16.tar.gz
# tar zxvf nagios-plugins-1.4.16.tar.gz
# cd nagios-plugins-1.4.16
# ./configure –prefix=/usr/local/nagios
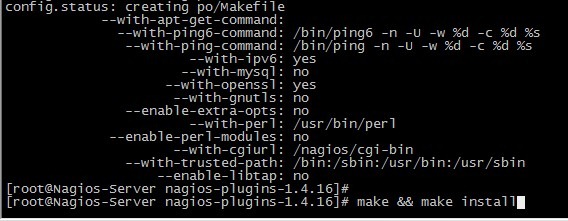
# make && make install

5.6 Install and Configure Apache and PHP
Apache and PHP are not strictly required for installing Nagios, but Nagios provides a web monitoring interface through which you can clearly see the running status of monitored hosts and resources. Therefore, installing a web service is highly recommended.
Note that starting from Nagios version 3.1.x, PHP support is required when configuring the web monitoring interface. Since the Nagios version we downloaded is nagios-3.4.3, after compiling and installing Apache, we also need to compile the PHP module. The PHP version chosen here is php-5.4.10.
a. Install Apache
# wget http://archive.apache.org/dist/httpd/httpd-2.2.23.tar.gz
# tar zxvf httpd-2.2.23.tar.gz
# cd httpd-2.2.23
# ./configure –prefix=/usr/local/apache2
# make && make install
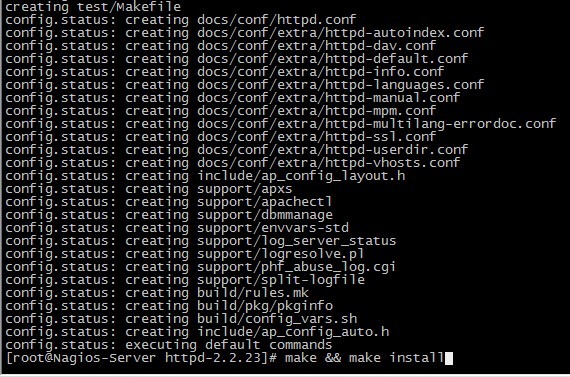
If the following error occurs:

Add –with-included-apr when compiling to resolve it.
b. Install PHP
# wget http://cn2.php.net/distributions/php-5.4.10.tar.gz
# tar zxvf php-5.4.10.tar.gz
# cd php-5.4.10
# ./configure –prefix=/usr/local/php –with-apxs2=/usr/local/apache2/bin/apxs
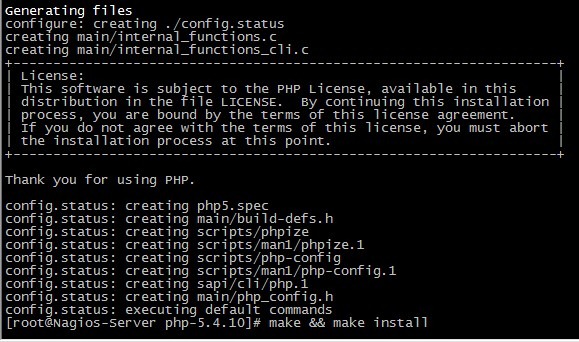
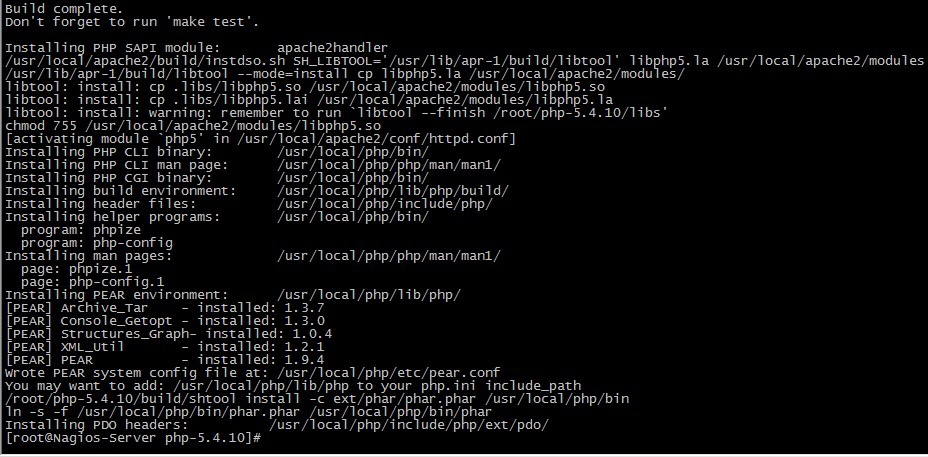
# make && make install
c. Configure Apache
Locate the Apache configuration file /usr/local/apache2/conf/httpd.conf
Find:
User daemon Group daemon
Change to
User nagios Group nagios
Then find
<IfModule dir_module> DirectoryIndex index.html </IfModule>
Change to
<IfModule dir_module> DirectoryIndex index.html index.php </IfModule>
Next, add the following content:
AddType application/x-httpd-php .php
For security purposes, it is generally recommended to require authentication before accessing the Nagios web monitoring pages. This requires adding authentication configuration, i.e., appending the following information to the end of the httpd.conf file:

#setting for nagios ScriptAlias /nagios/cgi-bin "/usr/local/nagios/sbin" <Directory "/usr/local/nagios/sbin"> AuthType Basic Options ExecCGI AllowOverride None Order allow,deny Allow from all AuthName "Nagios Access" AuthUserFile /usr/local/nagios/etc/htpasswd // Authentication file for this directory access Require valid-user </Directory> Alias /nagios "/usr/local/nagios/share" <Directory "/usr/local/nagios/share"> AuthType Basic Options None AllowOverride None Order allow,deny Allow from all AuthName "nagios Access" AuthUserFile /usr/local/nagios/etc/htpasswd Require valid-user </Directory>
d. Create Apache Directory Authentication File
In the configuration above, the directory authentication file htpasswd is specified. Now let’s create this file:
# /usr/local/apache2/bin/h