

For a Linux system administrator, ensuring the systems under management are in good condition is the top priority. There are many tools to help monitor processes, such as top and htop, but they all fall short when compared to collectl .
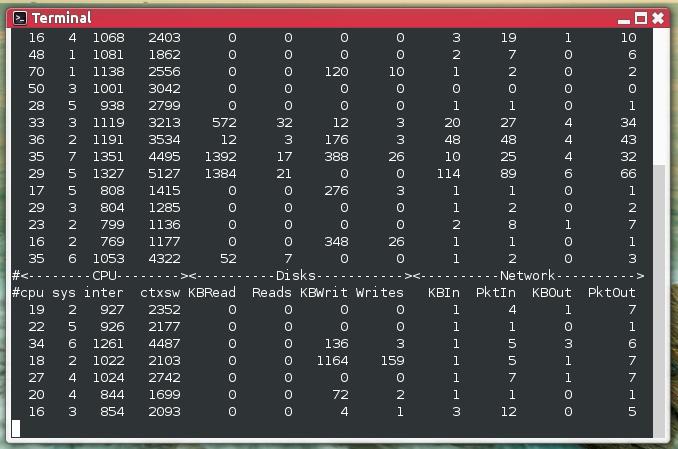
collectlis an excellent utility with rich command-line functionality for collecting performance data describing the current system state. Unlike most monitoring tools, collectl is not limited to a narrow set of metrics – it can collect data about CPU, disk, memory, network, sockets, TCP, inodes, InfiniBand, Lustre, NFS, processes, Quadrics, slabs, and buddyinfo.
Using collectl another benefit is that it can replace specialized tools such as top, ps, iotop, and others. So what collectl features make it such a useful tool?
After much research, I have summarized some very important features of collectl command-line functionality.
Collectl Features
-
Can run interactively or as a daemon, or both simultaneously.
-
Can display output in multiple formats.
-
Can monitor almost all subsystems.
-
Can replace many tools like ps, top, iotop, vmstat.
-
Can record and replay captured data.
-
Can export data in multiple formats (useful when analyzing with external tools).
-
Can run as a service to monitor remote machines or entire clusters.
-
Can display data on terminal, write to file, or send to a socket.
How to Install collectl on Linux
collectlCan run on all Linux distributions; the only requirement is Perl, so before installing collectl make sure you havePerl。
For Debian/Ubuntu/Linux Mint
The following command installs collectl on Debian-based systems like Ubuntu.
- $ sudo apt–get install collectl
For RHEL/CentOS/Fedora
If using a Red Hat-based distribution, use yum to install it.
- # yum install collectl
Some collectl Examples
After installing collectl, you can run it in the terminal without any options. The following command displays CPU, disk, and network info in a concise format.
- # collectl
- waiting for 1 second sample…
- #
- #cpu sys inter ctxsw KBRead Reads KBWrit Writes KBIn PktIn KBOut PktOut
- 13 5 790 1322 0 0 92 7 4 13 0 5
- 10 2 719 1186 0 0 0 0 3 9 0 4
- 12 0 753 1188 0 0 52 3 2 5 0 6
- 13 2 733 1063 0 0 0 0 1 1 0 1
- 25 2 834 1375 0 0 0 0 1 1 0 1
- 28 2 870 1424 0 0 36 7 1 1 0 1
- 19 3 949 2271 0 0 44 3 1 1 0 1
- 17 2 809 1384 0 0 0 0 1 6 0 6
- 16 2 732 1348 0 0 0 0 1 1 0 1
- 22 4 993 1615 0 0 56 3 1 2 0 3
As shown above, the output is easy to read as it displays one line at a time.
Running collectl without arguments shows these subsystems:
- cpu
- Disk
- Network
Tip: A subsystem is each measurable system resource.
You can also show statistics for all subsystems except slabs using the -all option.
- # collectl –all
- waiting for 1 second sample…
- #
- #cpu sys inter ctxsw Cpu0 Cpu1 Free Buff Cach Inac Slab Map Fragments KBRead Reads KBWrit Writes KBIn PktIn KBOut PktOut IP Tcp Udp Icmp Tcp Udp Raw Frag Handle Inodes Reads Writes Meta Comm
- 16 3 817 1542 430 390 1G 175M 1G 683M 193M 1G nsslkjjebbk 0 0 24 3 1 1 0 1 0 0 0 0 623 0 0 0 8160 240829 0 0 0 0
- 11 1 745 1324 316 426 1G 175M 1G 683M 193M 1G nsslkjjebbk 0 0 0 0 0 3 0 2 0 0 0 0 622 0 0 0 8160 240828 0 0 0 0
- 15 2 793 1683 371 424 1G 175M 1G 683M 193M 1G ssslkjjebbk 0 0 0 0 1 1 0 1 0 0 0 0 622 0 0 0 8160 240829 0 0 0 0
- 16 2 872 1875 427 446 1G 175M 1G 683M 193M 1G ssslkjjebbk 0 0 24 3 1 1 0 1 0 0 0 0 622 0 0 0 8160 240828 0 0 0 0
- 24 2 842 1383 473 368 1G 175M 1G 683M 193M 1G ssslkjjebbk 0 0 168 6 1 1 0 1 0 0 0 0 622 0 0 0 8160 240828 0 0 0 0
- 27 3 844 1099 478 365 1G 175M 1G 683M 193M 1G nsslkjjebbk 0 0 0 0 1 6 1 9 0 0 0 0 622 0 0 0 8160 240828 0 0 0 0
- 26 5 823 1238 396 428 1G 175M 1G 683M 193M 1G ssslkjjebbk 0 0 0 0 2 11 3 9 0 0 0 0 622 0 0 0 8160 240828 0 0 0 0
- 15 1 753 1276 361 391 1G 175M 1G 683M 193M 1G ssslkjjebbk 0 0 40 3 1 2 0 3 0 0 0 0 623 0 0 0 8160 240829 0 0 0 0
How do you monitor CPU usage? The -s option controls which subsystem data to collect and display.
For example, the following command summarizes CPU usage.
- # collectl -sc
- waiting for 1 second sample…
- #
- #cpu sys inter ctxsw
- 15 2 749 1155
- 16 3 772 1445
- 14 2 793 1247
- 27 4 887 1292
- 24 1 796 1258
- 16 1 743 1113
- 15 1 743 1179
- 14 1 706 1078
- 15 1 764 1268
When you combine this with“scdn”what happens? The best way to learn CLI tools is practice, so run this command and see:
- # collectl -scdn
- waiting for 1 second sample…
- #
- #cpu sys inter ctxsw KBRead Reads KBWrit Writes KBIn PktIn KBOut PktOut
- 25 4 943 3333 0 0 0 0 1 1 0 2
- 27 3 825 2910 0 0 0 0 1 1 0 1
- 27 5 886 2531 0 0 0 0 0 0 0 1
- 20 4 872 2406 0 0 0 0 1 1 0 1
- 26 1 854 2091 0 0 20 2 1 1 0 1
- 39 4 1004 3398 0 0 0 0 2 8 3 6
- 41 6 955 2464 0 0 40 3 1 2 0 3
- 25 7 890 1609 0 0 0 0 1 1 0 1
- 16 2 814 1165 0 0 796 43 2 2 0 2
- 14 1 779 1383 0 0 48 6 1 1 0 1
- 11 2 795 1285 0 0 0 0 2 14 1 14
You can easily see the default options are“cdn”representing CPU, disk, and network data. Running collectl with this option produces the same output as“collectl -scn”.
To collect memory data, use this command:
- # collectl -sm
- waiting for 1 second sample…
- #
- #Free Buff Cach Inac Slab Map
- 1G 177M 1G 684M 193M 1G
- 1G 177M 1G 684M 193M 1G
- 1G 177M 1G 684M 193M 1G
- 1G 177M 1G 684M 193M 1G
- 1G 177M 1G 684M 193M 1G
- 1G 177M 1G 684M 193M 1G
- 1G 177M 1G 684M 193M 1G
- 1G 177M 1G 684M 193M 1G
The output above is very useful for understanding memory usage, free memory, and performance-related information.
Want to collect some TCP data? Use this command:
- # collectl -st
- waiting for 1 second sample…
- #
- # IP Tcp Udp Icmp
- 0 0 0 0
- 0 0 0 0
- 0 0 0 0
- 0 0 0 0
- 0 0 0 0
- 0 0 0 0
- 0 0 0 0
- 0 0 0 0
- 0 0 0 0
- 0 0 0 0
- 0 0 0 0
Once proficient, you can combine options. For example, combine the TCP“t”option with the CPU“c”option. Here is the command:
- # collectl -stc
- waiting for 1 second sample…
- #
- #cpu sys inter ctxsw IP Tcp Udp Icmp
- 23 8 961 3136 0 0 0 0
- 24 5 916 3662 0 0 0 0
- 21 8 848 2408 0 0 0 0
- 30 10 916 2674 0 0 0 0
- 38 3 826 1752 0 0 0 0
- 31 3 820 1408 0 0 0 0
- 15 5 781 1335 0 0 0 0
- 17 3 802 1314 0 0 0 0
- 17 3 755 1218 0 0 0 0
- 14 2 788 1321 0 0 0 0
Since remembering all options is difficult, here is a summary list:
- b – buddy info (memory fragmentation)
- c – CPU
- d – Disk
- f – NFS V3 Data
- i – Inode and File System
- j – Interrupts
- l – Lustre
- m – Memory
- n – Networks
- s – Sockets
- t – TCP
- x – Interconnect
- y – Slabs (system object cache)
Disk usage is important for any admin or Linux user. This command monitors it:
- # collectl -sd
- waiting for 1 second sample…
- #
- #KBRead Reads KBWrit Writes
- 0 0 0 0
- 0 0 0 0
- 0 0 92 7
- 0 0 0 0
- 0 0 36 3
- 0 0 0 0
- 0 0 0 0
- 0 0 100 7
- 0 0 0 0
You can also use“-sD”option to collect data for individual disks, though it will not show all disks.
- # collectl -sD
- waiting for 1 second sample…
- # DISK STATISTICS (/sec)
- # Pct
- #Name KBytes Merged IOs Size KBytes Merged IOs Size RWSize QLen Wait SvcTim Util
- sda 0 0 0 0 52 11 2 26 26 1 8 8 1
- sda 0 0 0 0 0 0 0 0 0 0 0 0 0
- sda 0 0 0 0 24 0 2 12 12 0 0 0 0
- sda 0 0 0 0 152 0 4 38 38 0 0 0 0
- sda 0 0 0 0 192 45 3 64 64 1 20 20 5
- sda 0 0 0 0 204 0 2 102 102 0 0 0 0
- sda 0 0 0 0 0 0 0 0 0 0 0 0 0
- sda 0 0 0 0 116 26 3 39 38 1 16 16 4
- sda 0 0 0 0 0 0 0 0 0 0 0 0 0
- sda 0 0 0 0 0 0 0 0 0 0 0 0 0
- sda 0 0 0 0 32 5 3 11 10 1 16 16 4
- sda 0 0 0 0 0 0 0 0 0 0 0 0 0
You can also use other detailed subsystems. Here is a list:
- C – CPU
- D – Disk
- E – Environmental data (fan, power, temp), via ipmitool
- F – NFS Data
- J – Interrupts
- L – Lustre OST detail OR client Filesystem detail
- N – Networks
- T – 65 TCP counters only available in plot format
- X – Interconnect
- Y – Slabs (system object caches)
- Z – Processes
collectl has many options that cannot all be covered in one article. However, using it as top and ps tool is worth mentioning.
Using collectl like top is easy — run this command and see output similar to top .
- # collectl –top
- # TOP PROCESSES sorted by time (counters are /sec) 13:11:02
- # PID User PR PPID THRD S VSZ RSS CP SysT UsrT Pct AccuTime RKB WKB MajF MinF Command
- ^COuch!tecmint 20 1 40 R 1G 626M 0 0.01 0.14 15 28:48.24 0 0 0 109 /usr/lib/firefox/firefox
- 3403 tecmint 20 1 40 R 1G 626M 1 0.00 0.20 20 28:48.44 0 0 0 600 /usr/lib/firefox/firefox
- 5851 tecmint 20 4666 0 R 17M 13M 0 0.02 0.06 8 00:01.28 0 0 0 0 /usr/bin/perl
- 1682 root 20 1666 2 R 211M 55M 1 0.02 0.01 3 03:10.24 0 0 0 95 /usr/bin/X
- 3454 tecmint 20 3403 8 S 216M 45M 1 0.01 0.02 3 01:23.32 0 0 0 0 /usr/lib/firefox/plugin–container
- 4658 tecmint 20 4657 3 S 207M 17M 1 0.00 0.02 2 00:08.23 0 0 0 142 gnome–terminal
- 2890 tecmint 20 2571 3 S 340M 68M 0 0.00 0.01 1 01:19.95 0 0 0 0 compiz
- 3521 tecmint 20 1 24 S 710M 148M 1 0.01 0.00 1 01:47.84 0 0 0 0 skype
- 1 root 20 0 0 S 3M 2M 0 0.00 0.00 0 00:02.57 0 0 0 0 /sbin/init
- 2 root 20 0 0 S 0 0 1 0.00 0.00 0 00:00.00 0 0 0 0 kthreadd
- 3 root 20 2 0 S 0 0 0 0.00 0.00 0 00:00.60 0 0 0 0 ksoftirqd/0
- 5 root 0 2 0 S 0 0 0 0.00 0.00 0 00:00.00 0 0 0 0 kworker/0:0H
- 7 root 0 2 0 S 0 0 0 0.00 0.00 0 00:00.00 0 0 0 0 kworker/u:0H
- 8 root RT 2 0 S 0 0 0 0.00 0.00 0 00:04.42 0 0 0 0 migration/0
- 9 root 20 2 0 S 0 0 0 0.00 0.00 0 00:00.00 0 0 0 0 rcu_bh
- 10 root 20 2 0 R 0 0 0 0.00 0.00 0 00:02.22 0 0 0 0 rcu_sched
- 11 root RT 2 0 S 0 0 0 0.00 0.00 0 00:00.05 0 0 0 0 watchdog/0
- 12 root RT 2 0 S 0 0 1 0.00 0.00 0 00:00.07 0 0 0 0 watchdog/1
- 13 root 20 2 0 S 0 0 1 0.00 0.00 0 00:00.73 0 0 0 0 ksoftirqd/1
- 14 root RT 2 0 S 0 0 1 0.00 0.00 0 00:01.96 0 0 0 0 migration/1
- 16 root 0 2 0 S 0 0 1 0.00 0.00 0 00:00.00 0 0 0 0 kworker/1:0H
- 17 root 0 2 0 S 0 0 1 0.00 0.00 0 00:00.00 0 0 0 0 cpuset
Finally, run this command to use collectl like ps. You get process information similar to“ps”.
- # collectl -c1 -sZ -i:1
- waiting for 1 second sample…
- ### RECORD 1 >>> tecmint-vgn-z13gn <<< (1397979716.001) (Sun Apr 20 13:11:56 2014) ###
- # PROCESS SUMMARY (counters are /sec)
- # PID User PR PPID THRD S VSZ RSS CP SysT UsrT Pct AccuTime RKB WKB MajF MinF Command
- 1 root 20 0 0 S 3M 2M 0 0.00 0.00 0 00:02.57 0 0 0 0 /sbin/init
- 2 root 20 0 0 S 0 0 1 0.00 0.00 0 00:00.00 0 0 0 0 kthreadd
- 3 root 20 2 0 S 0 0 0 0.00 0.00 0 00:00.60 0 0 0 0 ksoftirqd/0
- 5 root 0 2 0 S 0 0 0 0.00 0.00 0 00:00.00 0 0 0 0 kworker/0:0H
- 7 root 0 2 0 S 0 0 0 0.00 0.00 0 00:00.00 0 0 0 0 kworker/u:0H
- 8 root RT 2 0 S 0 0 0 0.00 0.00 0 00:04.42 0 0 0 0 migration/0
- 9 root 20 2 0 S 0 0 0 0.00 0.00 0 00:00.00 0 0 0 0 rcu_bh
- 10 root 20 2 0 S 0 0 0 0.00 0.00 0 00:02.24 0 0 0 0 rcu_sched
- 11 root RT 2 0 S 0 0 0 0.00 0.00 0 00:00.05 0 0 0 0 watchdog/0
- 12 root RT 2 0 S 0 0 1 0.00 0.00 0 00:00.07 0 0 0 0 watchdog/1
- 13 root 20 2 0 S 0 0 1 0.00 0.00 0 00:00.73 0 0 0 0 ksoftirqd/1
- 14 root RT 2 0 S 0 0 1 0.00 0.00 0 00:01.96 0 0 0 0 migration/1
- 16 root 0 2 0 S 0 0 1 0.00 0.00 0 00:00.00 0 0 0 0 kworker/1:0H
- 17 root 0 2 0 S 0 0 1 0.00 0.00 0 00:00.00 0 0 0 0 cpuset
- 18 root 0 2 0 S 0 0 1 0.00 0.00 0 00:00.00 0 0 0 0 khelper
- 19 root 20 2 0 S 0 0 0 0.00 0.00 0 00:00.00 0 0 0 0 kdevtmpfs
- 20 root 0 2 0 S 0 0 0 0.00 0.00 0 00:00.00 0 0 0 0 netns
- 21 root 20 2 0 S 0 0 0 0.00 0.00 0 00:00.00 0 0 0 0 bdi–default
- 22 root 0 2 0 S 0 0 0 0.00 0.00 0 00:00.00 0 0 0 0 kintegrityd
Many sysadmins will love this tool and appreciate its power. To learn more, read the collectl man page and practice.
Type this command to start reading:
- # man collectl
Reference Links
via: http://www.tecmint.com/linux-performance-monitoring-with-collectl-tool/