

Few command-line tools adapt to different terminal sizes, providing users with the maximum amount of information. Most tools behave similarly——either displaying garbled information or throwing an error message. However, Glances is a tool that supports displaying a wealth of system/network monitoring information across terminals ranging from the classic 80×24 size to any larger dimensions.
Note — All examples in this article have been tested on Ubuntu 13.04’s bash shell.
A Brief Tutorial
Glances is a system monitoring tool that displays a variety of system-related information in your terminal. This information includes:
- CPU-related information
- Disk I/O related information
- Memory-related information
- Mount point related information
- Network interface related information
- Process-related information
- And more
Here is a sample screenshot of glances:
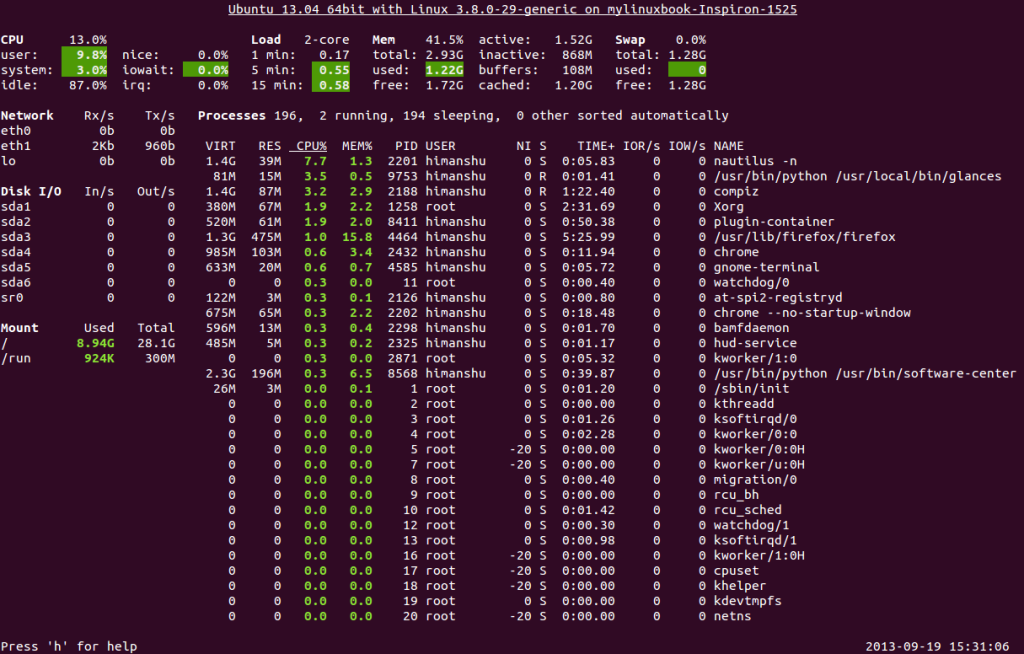
It is written in Python and leverages the psutils library to fetch all system-related information for display. Glances’ terminal display is highly flexible; for instance, it can show a considerable amount of information even on a terminal as small as 80×24.
Here is a screenshot of glances on a smaller terminal:
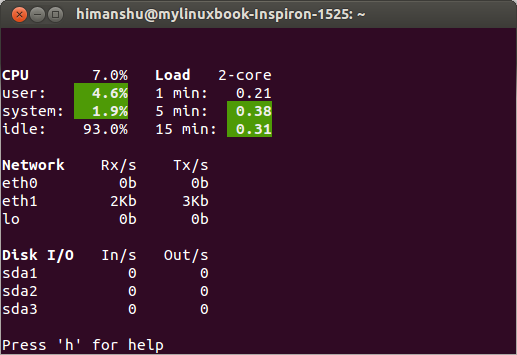
You can see that it still manages to display some information even on a smaller terminal.
You can use Glances not only to monitor your local system but also to monitor remote systems. To use glances on a remote system, run the following command on the server:
glances -s
And execute this on the client side:
glances -c [ip-address-of-server]
When using glances in Client/Server mode, there are some important points users should keep in mind [taken from the glances official documentation]:
On the server side, you can use -B address and -p port to set the binding IP address and port. On the client side, use -p port to specify the server port to connect to. The default binding address is 0.0.0.0 (meaning it listens on all network interfaces) and the default TCP port is 61209.
In C/S mode, limits are set on the server side. You can also define a connection password using -P password. Glances also supports IPv6, which can be bound to all IPv6 addresses using -B ::.
Furthermore, there are several command-line options available to customize the information displayed, such as:
- Use -m to disable mount-related information
- Use -n to disable network-related information
- Use -t to set the screen refresh interval in seconds
- And more
Explore and discover more of these options through the man page.
Beyond command-line options, glances provides many interactive help options you can use while glances is running. Here is the list of options:
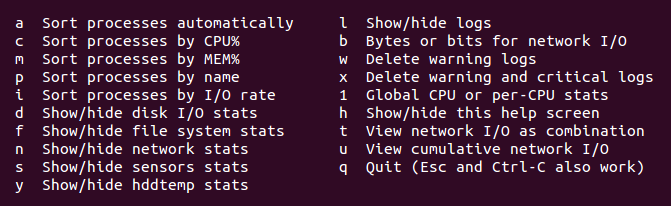
So you can see that glances is not only flexible in its display but also highly customizable.
Download/Install
Here are some important links related to the glances tool:
You can download and install Glances from the software repositories, but this requires the python-dev module to be pre-installed. Ubuntu users can download and install it directly through the Ubuntu Software Center. The version used in this article is 1.7.1 with PsUtil 0.6.1.
Conclusion
Glances is a tool that system administrators can use to get a quick overview of the complete system status. It is an excellent tool to have on your prized machine and can come in handy when debugging system-related issues. Its flexible display is arguably its best feature.
Pros
- Provides a wealth of system-related information under the same conditions
- Flexible display
Cons
- On smaller terminals, you must specify some options to see more information.
- Building from source depends on additional libraries, like python-dev.
Have you ever used Glances or a similar tool? What has your experience been? Share your stories.
via: http://mylinuxbook.com/glances-an-all-in-one-system-monitoring-tool/