

I’ve been pondering what example to use for the demonstration. After much thought, it’s best to stick with the official one. So how do we use zabbix to monitor web performance and availability? We break it down into several steps: opening the website, logging in, login verification, and logging out. That’s 4 small steps in total. Let’s look at the example.
Detection Flow
1. Open the website: If the HTTP code is 200 and the response HTML contains “Zabbix SIA”, the site opened successfully (the Zabbix page has this indicator).
2. Log in to the backend: POST the username and password to index.php. If the response is 200, the POST was successful. Then, use a regular expression to match the sid from the response HTML. This sid is a macro variable that can be used for logging out.
3. Verify login: Open the homepage and check if the HTML contains “Profile” (Profile only appears if the login was successful).
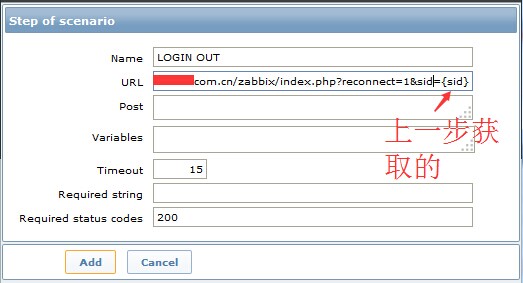
4. Log out: Pass the sid parameter to index.php to log out. A 200 response means the logout was successful.
You can use the item keys discussed in the previous section to get the speed, response time, or the latest error message for each step. Explore it on your own — it’s not difficult.
Create a Web Scenario
configuration->Host->Your Host->web->Create scenario (top right corner)
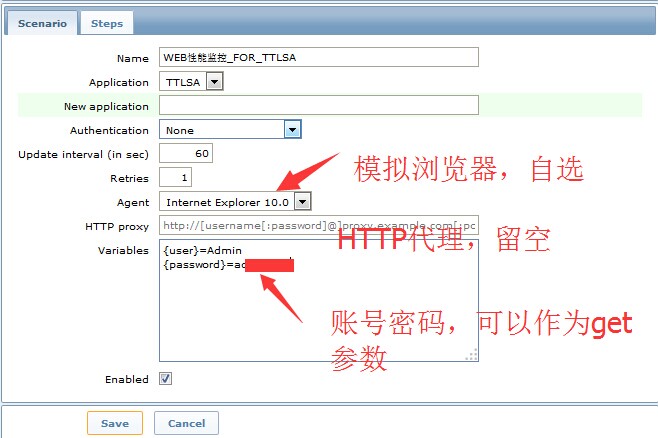
Create scenario – 01
Name: The name of the monitoring item.
Application: Which application to place it in. See “What is an Application“.
Authentication: Whether basic HTTP authentication is required. In most cases, it’s None. Does a user really need to authenticate again just to enter?
Update interval: The update cycle, default is 60 seconds. How often to run it.
Retries: Number of retry attempts.
Agent: Simulated browser.
HTTP proxy: Proxy. If your site has multiple servers, write your target server IP and port here, e.g., http://10.9.0.2:80. The default port is not 80, so don’t forget to specify 80.
Variables: Macro variables, to be used later. For more info, see “Zabbix User Macros“.
Web Monitoring Stage 1: Open Homepage
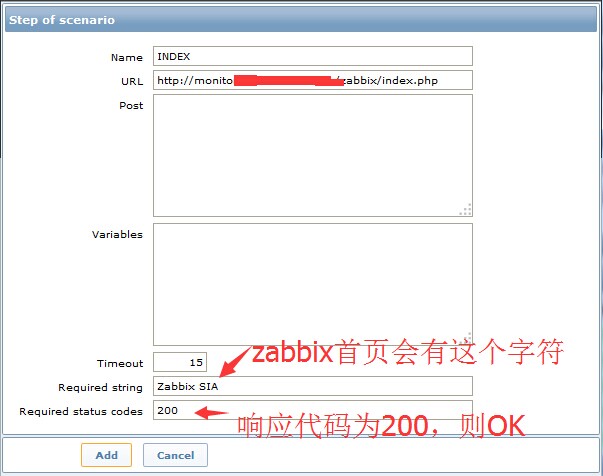
Create scenario – 02
A note on the steps:
name: The name of the current step, can be used in the item key.
url: The URL to be checked.
POST: The content you need to submit via POST, e.g., user=123&password=123456, or using macro variables like user={user}&password={password}. If GET is supported, you can write it directly in the URL.
variables: Variables. Macro variables defined here can be used in subsequent steps.
Timeout: Timeout duration, default is 15 seconds.
Required string: A string that must be present in the response content; otherwise, it fails.
Required status codes: The response code must be among these. Multiple response codes are separated by commas, e.g., 200,301,302.
Web Monitoring Stage 2: Login
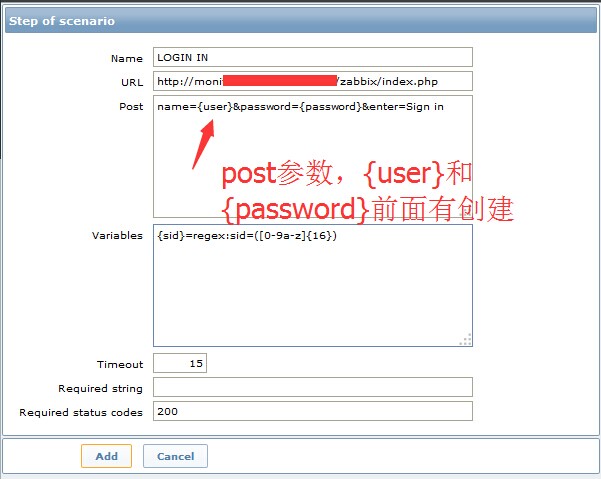
Create scenario – 03
Post the username and password. POST was already mentioned earlier.
Web Monitoring Stage 3: Verify Login
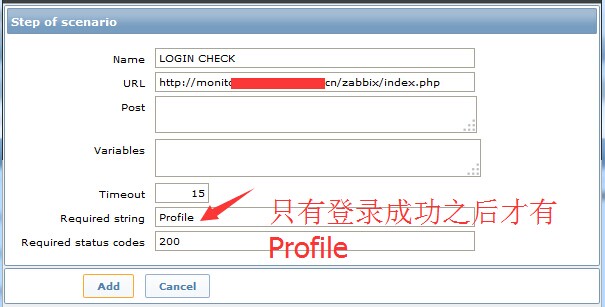
Create scenario – 04
Web Monitoring Stage 4: Log Out
Create scenario – 05
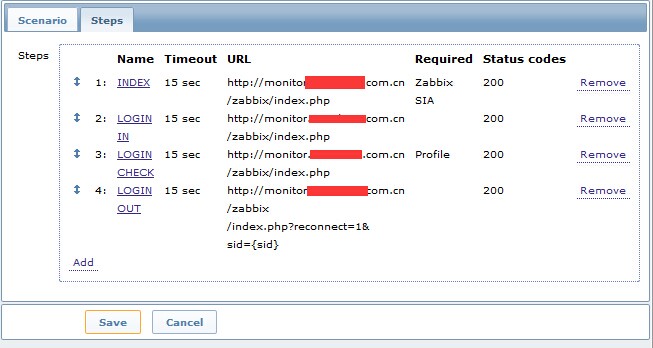
Web Monitoring Configuration Complete
Remember to save the account.
Create scenario – 06
View Results
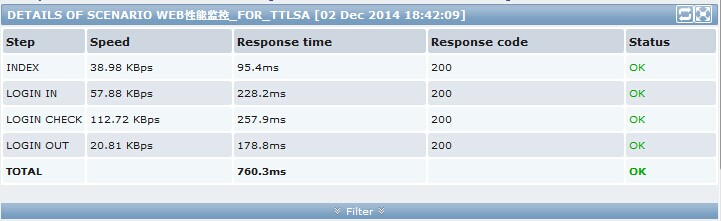
monitoring->web->filter your host->view “WEB Performance Monitoring_FOR_TTLSA”. The result is shown below.
Response time, speed, return status code for each stage, and the total response time.
Create scenario – 07
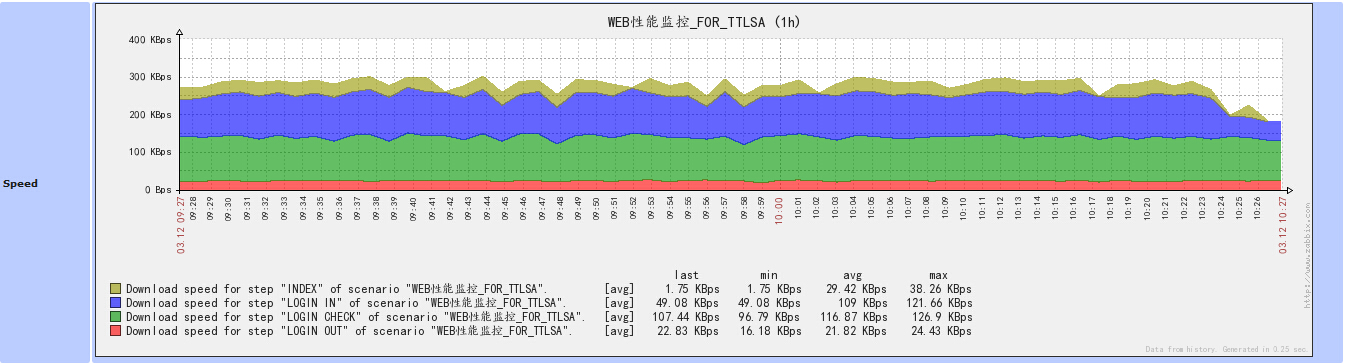
The chart below shows the download speed, broken down by each stage
Create scenario – 08
The chart below illustrates the response time
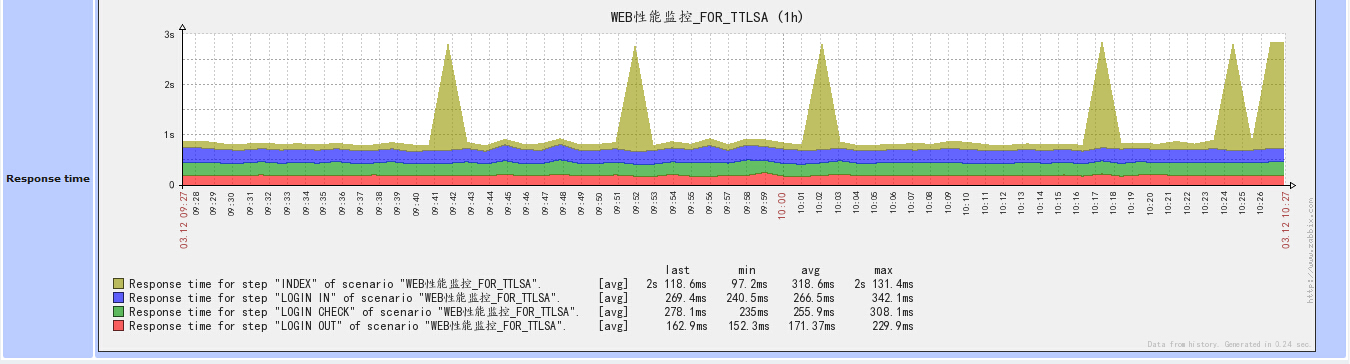
Create scenario – 09
The above shows everything working correctly. So, what does a failure look like? I changed the password to demonstrate. See the image below — the error occurred at the “LOGIN IN” step, and it failed to retrieve the SID.

Create scenario – 10
And what does a Required String mismatch look like? Let’s change the Required String in Stage 3 (Login CHECK) from “Profile” to “Profile1” and see the result.
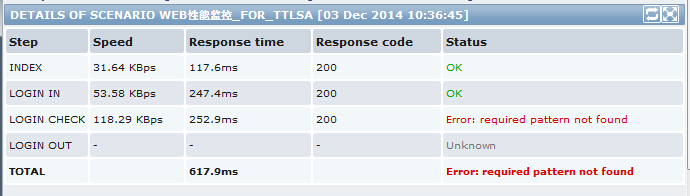
web scenario – 11
And with that, the web monitoring real-life scenario is complete.
Original article http://www.ttlsa.com/zabbix/zabbix-web-monitor-real-life-scenario/