The Evolution of Meizu System Operations Architecture
Categories: Cluster 2016-09-19
root
Qin Jun currently works on the Operations Platform within Meizu’s Flyme Platform R&D Department, responsible for the system operations of the Flyme foundational platform. He has experienced the growth of server infrastructure from hundreds to thousands of units. He possesses in-depth knowledge of Meizu’s basic network, system deployment and delivery, and resource operating cost verification. He currently manages an IaaS platform with over 6,000 servers, effectively supporting the basic services and game operations of the Flyme ecosystem.
Background
Meizu’s internet business started relatively early, back in 2011, and by 2014 it truly transformed into a mobile internet company. From 2014 onwards, Meizu’s internet business experienced explosive growth. By the end of 2015, Flyme registered users exceeded 30 million, the App Store hosted over 1 million applications, total downloads surpassed 10 billion, and revenue capability increased 12-fold year-over-year. Along with the rapid business development, the challenges faced by operations also grew, as did the number of problems encountered. At the same time, the operations architecture underwent continuous improvement and change.
History of System Operations Architecture Evolution
Over the past few years, we have primarily focused on optimizing operations work across the dimensions of quality, efficiency, process, and cost, gradually transforming from operations to technology operations to enhance our own value.
I. The Ancient Era (2011.1 – 2011.12)
Scale
Racks: 1
Servers: 5
Services: 2
Staffing: Developers handled operations part-time
Problems
Data center stability
Lack of monitoring
Architecture single points of failure
II. The Stone Age (2012.1 – 2014.6)
Scale
IDCs: 1
Racks: 30
Servers / VMs: 800
Services: > 100
Manpower: 12 Ops
Issues
IBM BladeCenter, EMC Storage, VMware Virtualization, single hardware vendor ⇨ Eliminate IOE
Network instability, traffic spikes on campaign days ⇨ Build new network architecture with bandwidth redundancy
Insufficient data center resources, difficult to scale ⇨ Migrate data centers, resource redundancy
Single points of failure in some business architectures ⇨ Eliminate single points, ensure reliability
Deployment: Manual operation, dependent on people ⇨ Automated Ops tools
Monitoring: Low coverage ⇨ Scheduled inspections
DB pressure ⇨ Use SSD
Low security ⇨ RSA Token + Bastion Host, self-developed WAF, egress ACL control, purchase DDoS traffic scrubbing service
3. Bronze Age (2014.7 – 2015.12)
Scale
IDCs: Multiple
Racks: > 150
Servers / VMs: > 4000
Services: > 200
Manpower: 35 Ops Platform
Issues
Low standardization rate, low monitoring coverage, high maintenance cost, low effectiveness ⇨ Standardized inspections, monitoring inspections
Difficult data center expansion, high cost ⇨ Migration, understand industry pricing
IOE, virtualization solutions ⇨ Use X86 servers, build Meizu Cloud Platform based on KVM
Single points of failure in some business architectures ⇨ Sort out single-point services, unify high-availability architecture
Diverse failures ⇨ Establish knowledge base, vendor technical support
Sudden scale increase ⇨ Capacity management
Low Resource Scaling Efficiency ⇨ Resource Redundancy, Automated Deployment Platform
Low Configuration Management Accuracy ⇨ Process-Oriented Management
Business Availability ⇨ Architecture Redundancy, Two-City Three-Center Deployment
4. The Iron Age (2016.1 – Present)
Scale
IDCs: Multiple
Racks: > 200
Servers/VMs: > 6,000
Businesses: > 200
Staff: 43 on the Ops Platform
Issues
Monitoring Issues: Metric Quantification and Visualization ⇨ Unified Alert Platform, Alert Convergence
Too Many Machine Packages, Custom Business Needs ⇨ Consolidate Same-Type Models Based on Capacity
High Operational Costs, Need to Quantify ROI for Each Business ⇨ Resource Usage Assessment, Build Internal Revenue System
Workflow Standardization ⇨ Ticketing System
Low Resource Utilization ⇨ Capacity System
Contingency Plan Management ⇨ Scheduled Drills
Review and Summary
Infrastructure Planning (Explosive Business Growth)
IDC Migration from Single to Multiple, Building Two-City Three-Center Architecture
Reserve Sufficient Rack Resources to Guarantee Rapid Deployment Needs
De-IOE, Build Meizu Cloud Platform Based on KVM, Introduce Docker Container Platform, Implement Microservices
Monitoring, Alerting, and Localization (Timely Detection and Location)
Alert Escalation: Email, SMS, DingTalk
Automated monitoring device addition, conducting inspections based on the CMDB business tree to ensure monitoring coverage
BI Alerts, Metrics System
Cost Control
Improve Resource Utilization: Monitoring System + Capacity Management Platform
Container-as-a-Service
Supplier Management: Introduce multiple vendors
Flyme Internal Settlement: Establish an internal revenue system
Business Homogeneity and Differentiation (Maintenance Cost)
Standardization: OS Standardization, Hardware Standardization, Software Standardization, Architecture Standardization, Component Standardization, Protocol Standardization
Specifications: Logging Specification, Deployment Specification
Manual Repetitive Operations, Reliance on People (Efficiency)
Ops Automation and Platformization to Meet Rapid Delivery Requirements
Launch Process + Standardized Packaging + Self-Service Release + Canary Release (Continuous Delivery)
Contingency Plans
Geo-Redundancy Active-Active + Fast Switchover Measures
Dedicated Line Switchover Drill
Overall Ops Architecture
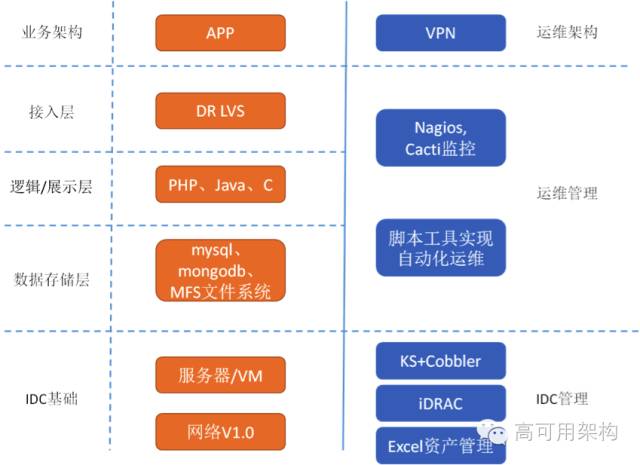
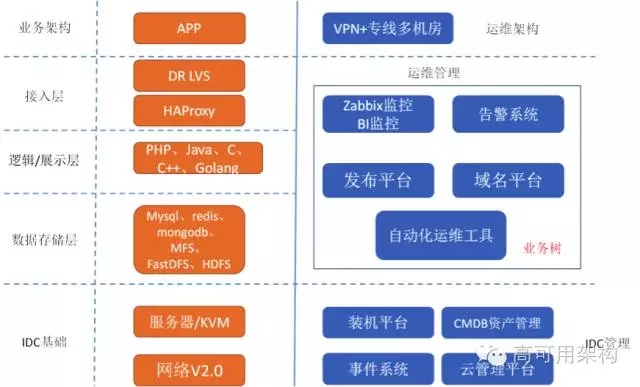
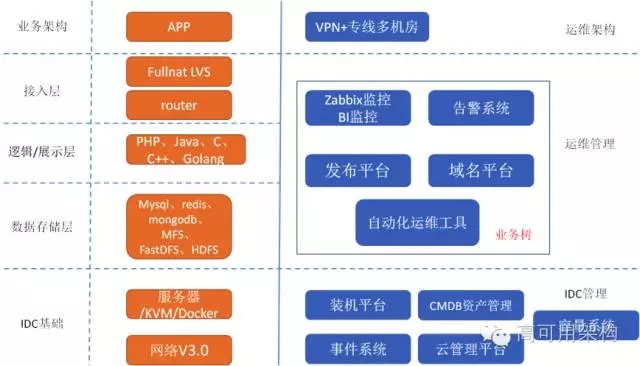
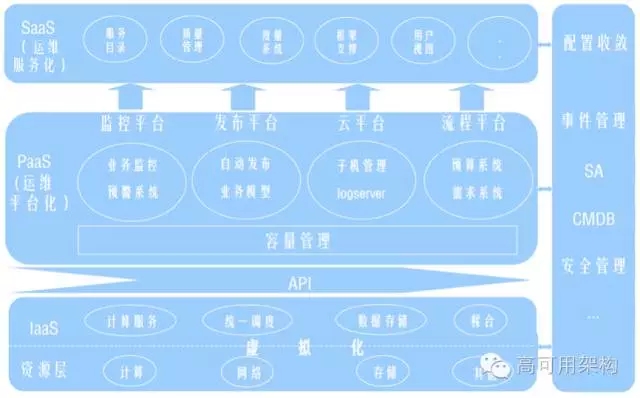
Meizu’s overall architecture, like most internet companies, adopts a multi-tier layered model. Currently, all services have high-availability solutions, with applications or databases running on at least two or more instances. Of course, the actual business is much more complex; the above only abstracts it to a simple level.
Meizu’s operations platform and technical platform have developed many practical systems, which together form the overall operations system. In terms of automation, we are also feeling our way across the river, starting from reality, identifying pain points, summarizing and organizing requirements, and considering how to implement them. Our approach is to define priorities, break down tasks, and start with the easiest ones first.by identifying the areas that can boost efficiency the most, then integrate them. Through the integration of various subsystems, you gradually form an automated operations framework that suits your needs.
Monitoring System
Next, let me introduce our monitoring system. Meizu’s infrastructure layer monitoring uses Zabbix, which is a monitoring system well-suited to our current scale. Zabbix is an enterprise-class open-source solution providing distributed system monitoring and network monitoring capabilities based on a web interface. Zabbix can monitor various network parameters to ensure the secure operation of server systems; it also provides a flexible notification mechanism to allow system administrators to quickly locate and resolve various issues.
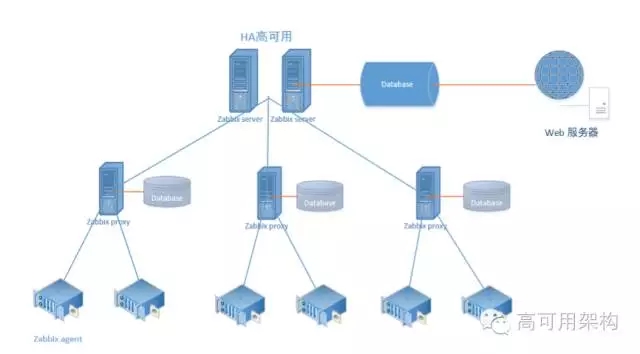
We use a server-proxy-client architecture, where the proxy acts as a bridge between the server and client. The proxy itself has no frontend and does not store data; it only temporarily holds data sent by the agentd before submitting it to the server. We standardized the monitoring templates, defining different templates for different groups, so that the operations/development personnel for each group receive alerts for their own business. By defining matching actions in the Zabbix backend based on hostname matching, when the CMDB status is changed to “In Operation,” the agent automatically reports its group based on the CMDB host’s business tree and adds it to the server side, reducing the previous manual workload of adding monitors. Simultaneously, Zabbix pulls host data from the CMDB for comparison to discover which hosts were not added successfully and sends periodic emails to the relevant operations personnel for handling, thus ensuring monitoring coverage.
Unified Alerting Platform
Alert Convergence
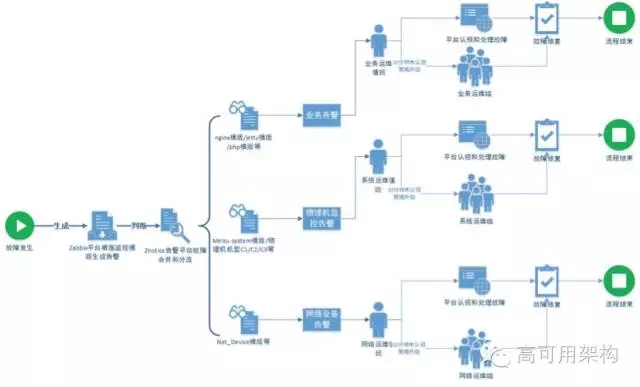
By feeding Zabbix alert information into the unified alerting platform, we achieve alert convergence. Using pre-set different thresholds for different severity scenarios, we perform batch alert convergence to prevent instantaneous alert bursts from causing confusion for users, converging them by business module.
Alert Severity Classification
1) Configure the trigger severity value in Zabbix and set up the content for the Action Default message.
2) Configure the incident distribution function for the service in the unified alerting platform.
Configure escalation policies on the alerting platform; each escalation policy is configured with different alert reception methods and different recipients. Then, configure incident distribution in service management, matching based on the severity value in the sent message, distributing incidents matched for the Warning and High severity levels.
Through the mechanisms above, the number of SMS messages sent by Zabbix was reduced from over 5,000 per day to around 800 now, effectively cutting SMS costs.
OS Standardization Inspection System
Last year, we encountered an issue where the net.netfilter.nf_conntrack_max value setting did not take effect, and iptables was left enabled. This caused the KVM host machine’s NIC to easily drop packets under heavy traffic and high concurrency, affecting the stability of multiple services. The problem was eventually resolved by checking whether the host kernel parameter net.netfilter.nf_conntrack_max was set to 655350 and disabling iptables. We realized that at the OS layer, customization and standardization are necessary, and an inspection system is needed to discover non-standard machines for scheduled remediation.
System Routine Check
System time sync task, SELinux status, iptables status, eth0 link status, eth1 link status, bonding mode, NIC naming, yum repo configuration files, yum repo configuration file content, DNS configuration, MFS mount check
System Security Check
Check users with root privileges, check current empty-password users, passwd file read/write permissions, shadow file read/write permissions, group file read/write permissions, deny .rhosts file existence, enable tcp_syncookies, mitigate SYN flood attacks, optimize against SYN attacks, single-user mode boot password
Kernel Check
net.netfilter check, nf_conntrack check
More Secure Bastion Host
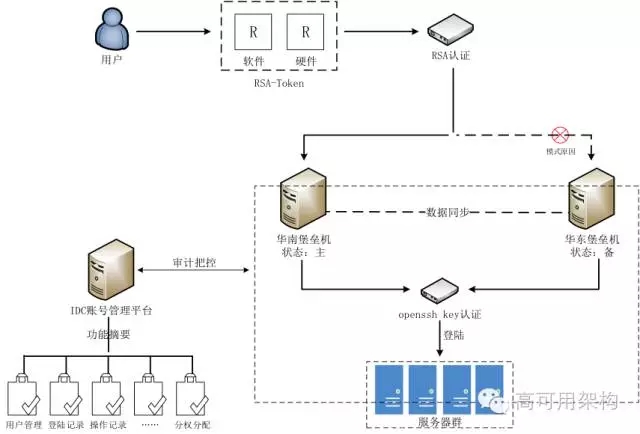
Our bastion host system uses RSA Token + Bastion Host mode to achieve role management and authorization approval, information resource access control, operation recording and auditing, and system change and maintenance control. This avoids issues such as chaotic login account management, unclear division of operations permissions, overly simple authentication methods, lack of monitoring measures during operations, and the absence of a reasonable statistical method for tracking R&D personnel’s operation frequencies.
Process Management
The closed-loop lifecycle of servers—introduction, production, operation, reuse, and decommissioning—requires efficient automated processes to support it. By designing process models for each workflow, which generally involve multiple departmental roles and systems, it is necessary to determine key steps, division of responsibilities, and system-to-system interfaces. To reduce process development costs, a hierarchical implementation model of atomic processes, composite processes, and business processes should be considered.
Resource delivery processes: resource procurement, routine requests, allocation, service launch/withdrawal, automatic acceptance checks, automatic deployment, pre-configured environment adjustments
Resource scheduling processes: server relocation, modification, recovery, spare parts allocation, etc.
End-of-lifecycle processes: server decommissioning, reuse and dismantling, scrap disposal, etc.
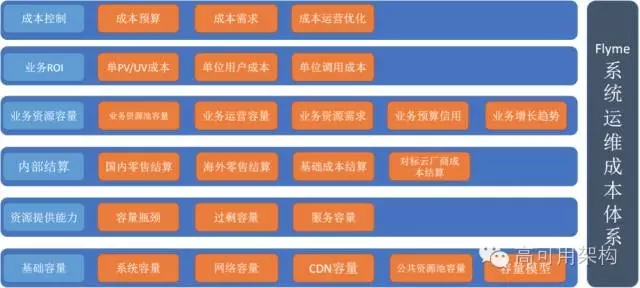
Flyme Operations Cost System
By establishing an internal revenue system, it is possible to more effectively quantify the investment in each business