

On Linux systems, the top command displays the real-time status of running processes. It shows useful information like CPU utilization, memory consumption, and details for each process. But did you know there is another command-line tool called 'htop'? It serves the same purpose as the traditional top command but offers more powerful features and can display even more information. In this article, we will explore the 'htop' command with practical examples.
The htop Command in Linux
Here is the relevant description excerpted from the htop man page:
It is similar to top, but allows you to scroll vertically and horizontally, so you can see all the processes running on the system, along with their full command lines.
You can perform related operations on a process (killing, renicing) without entering its PID.
Understanding Its Output First
The htop command displays information in an intuitive format. Below is a snapshot of HTOP’s output:
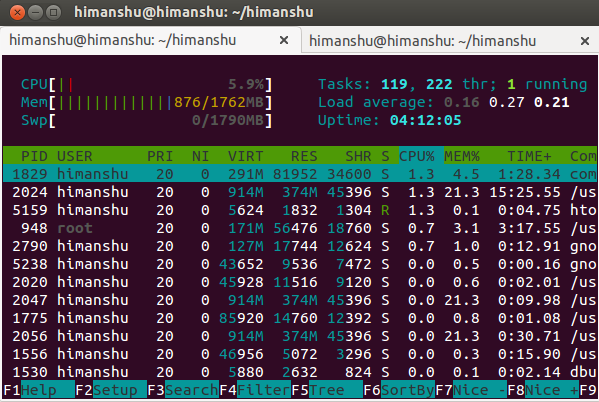
If you look at the top-left corner of the window, you will see real-time information on CPU load, memory consumption, and swap space. The top-right corner contains information on tasks, threads, load average, and system uptime.
The load average section provides three numbers, which simply represent the system’s average load over the past 5, 10, and 15 minutes. On a single-core system, a load average of 1 indicates 100% CPU utilization. Finally, the uptime figure indicates the total time elapsed since the system booted.
Below, we will further discuss this command with examples.
1. Edit Configuration with F2 Key
The htop command provides many customization options. All you need to do is press the F2 key from the main window.
Shown below are the available customization options:
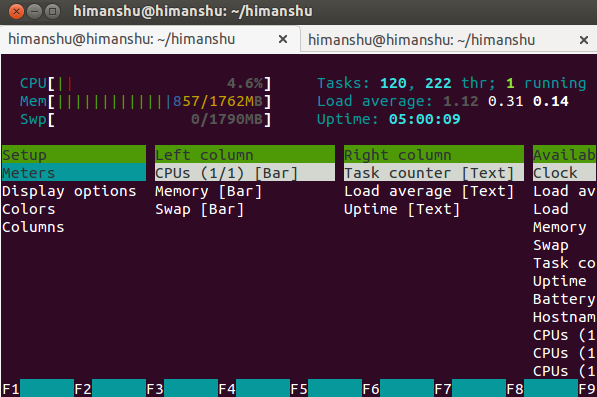
Simply use the arrow keys to navigate and change specific settings.
2. Send Signals via F9 Key
The htop command makes it easy to send any signal to a process within the htop window. Just press the F9 key.
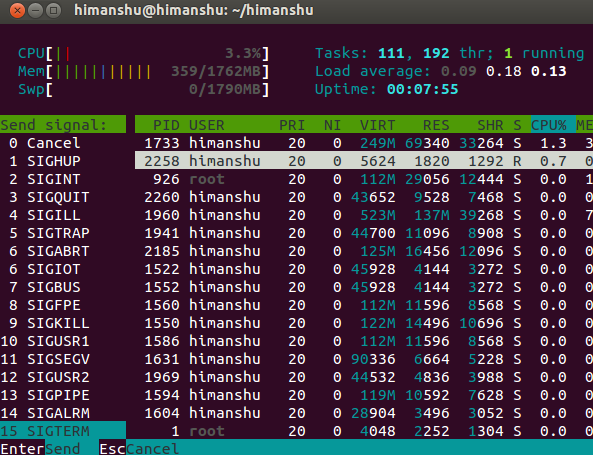
As you can see, the left part of the window lists all available signals, while the right part lists the processes. Just select a signal, choose a process, and press the enter key; the selected signal will then be sent to that process.
3. Display Tree View of Processes
The htop command also provides a tree view of processes.View Features. Press the F5 key to toggle.
Here is an example of htop displaying information in tree view:
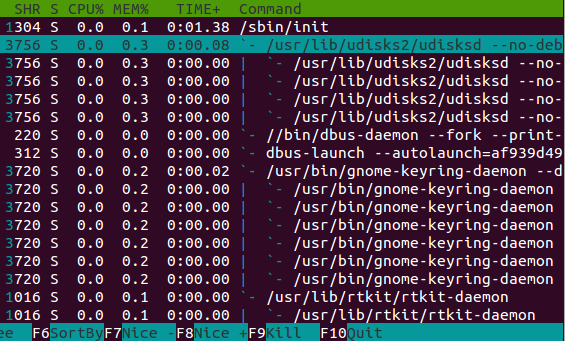
To exit tree view mode, press the F5 key once more.
4. Search for Processes with the F3 Key
The htop command provides an easy-to-use way to search for processes. Press the F3 key, and a text box will appear at the bottom of the window.
Here is an example:
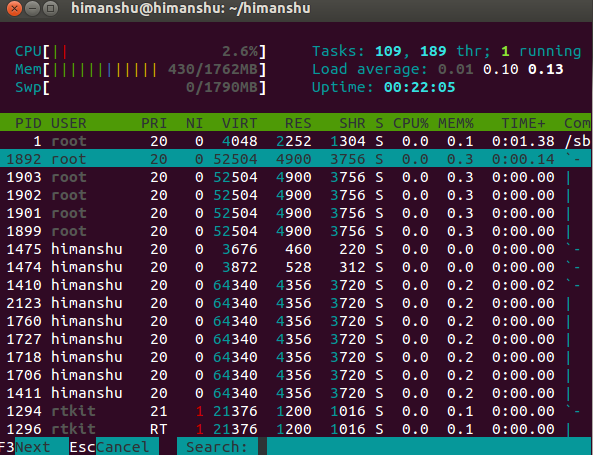
As you can see, a text prompt labeled ‘Search’ appears at the bottom of the window, where you can enter the name of a process and press Enter to search. If found, it will highlight the process in the listed process list.
5. Use the Space Bar to Color-Tag Process Entries
Tracking a specific process in a live view of running processes on a system is a major challenge. The entire list is constantly refreshing, and the order of processes keeps shifting. To address this, htop provides a very simple solution: color tagging. Yes, you can tag a process entry, and it will be displayed in a different color, making it much easier to track.
To tag a process entry, all you need to do is select the entry and press the ‘Space’ key. For example, in the screenshot below, I have color-tagged three process entries:
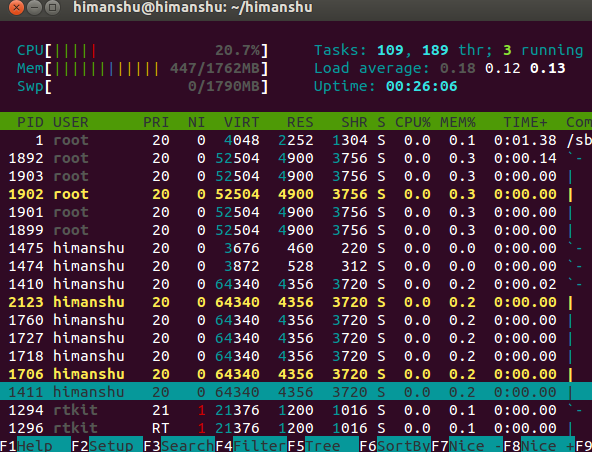
So using this method, you can easily keep track of the processes you want to monitor.
6. Command-Line Options
In addition to the hotkeys introduced above, htop also provides very useful command-line options. Here are some of them:
- -s option : Sort by a specified column. For example, the htop -s PID command will display output sorted by the PID column.
- -u option : Display a list of process information for a specified user. For example, the htop -u himanshu command will only show processes related to the user named himanshu.
- -d option : Set the refresh delay time. For example, the htop -d 100 command will make the output refresh after 1 second (the unit for the -d parameter is tenths of a second).
via: http://linoxide.com/linux-command/linux-htop-command/