

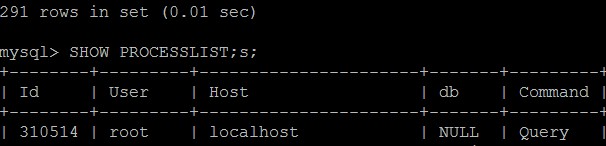
The output of the processlist command shows which threads are running and can help identify problematic queries. There are two ways to use this command.
1. Navigate to the mysql/bin directory and enter mysqladmin processlist;
2. Start mysql and enter show processlist;
If you have SUPER privileges, you can see all threads; otherwise, you can only see threads initiated by your account (meaning the threads running under the current corresponding MySQL account).
The output data format is as follows (only three rows are shown):
mysql> show processlist;
+—–+————-+——————–+——-+———+——-+———————————-+———-
| Id | User | Host | db | Command | Time| State | Info
+—–+————-+——————–+——-+———+——-+———————————-+———-
|207|root |192.168.0.20:51718 |mytest | Sleep | 5 | | NULL
|208|root |192.168.0.20:51719 |mytest | Sleep | 5 | | NULL
|220|root |192.168.0.20:51731 |mytest |Query | 84 | Locked |
select bookname,culture,value,type from book where id=001
Let’s briefly explain the meaning and purpose of each column. The first column, id, needless to say, is an identifier, very useful when you need to kill a statement. The user column shows the current user; if not root, this command only displays SQL statements within your permission scope. The host column shows from which IP and port this statement originated. It can be used to trace the user issuing problematic statements. The db column shows which database the process is currently connected to. The command column shows the command being executed by the current connection, typically Sleep, Query, or Connect. The time column indicates the duration the current state has lasted, in seconds. The state column displays the status of the SQL statement using the current connection—a crucial column. Detailed descriptions of all states follow later. Please note that state represents only one status during statement execution. A SQL query, for example, might need to go through states like copying to tmp table, Sorting result, and Sending data before completion. The info column displays the SQL statement; due to length limits, long SQL statements may not be fully displayed, but it’s an important basis for identifying problematic queries.
The most critical part of this command is the state column. The main states listed by MySQL are as follows:
Checking table
Checking the data table (this is automatic).
Closing tables
Flushing modified data to disk and closing tables that are no longer needed. This should be a very fast operation. If not, confirm whether the disk is full or under heavy load.
Connect Out
A replication slave server is connecting to the master server.
Copying to tmp table on disk
Because the temporary result set is larger than tmp_table_size, the temporary table is being moved from memory to disk storage to save memory.
Creating tmp table
Creating a temporary table to hold part of the query results.
deleting from main table
The server is executing the first part of a multi-table delete, just deleted from the first table.
deleting from reference tables
The server is executing the second part of a multi-table delete, deleting records from other tables.
Flushing tables
Executing FLUSH TABLES, waiting for other threads to close the data tables.
Killed
A kill request has been sent to a thread, so the thread will check the kill flag and will abort on the next kill request. MySQL checks the kill flag in each main loop, though in some cases the thread might take a short while to die. If the thread is locked by another thread, the kill request will take effect as soon as the lock is released.
Locked
Locked by another query.
Sending data
Processing records for a SELECT query and simultaneously sending the result to the client.
Sorting for group
Sorting is being performed for GROUP BY.
Sorting for order
Sorting is being performed for ORDER BY.
Opening tables
This process should be fast unless interfered with by other factors. For example, before an ALTER TABLE or LOCK TABLE statement completes, the data table cannot be opened by other threads. Attempting to open a table.
Removing duplicates
Executing a SELECT DISTINCT query, but MySQL was unable to optimize away the duplicate records in a previous phase. Therefore, MySQL needs to remove the duplicate records again before sending the result to the client.
Reopen table
Obtained a lock on a table, but the lock was only available after a table structure modification. The lock has been released, the data table closed, and an attempt is being made to reopen it.
Repair by sorting
The repair instruction is sorting to create indexes.
Repair with keycache
The repair instruction is using the index cache to create new indexes one by one. This will be slower than Repair by sorting.
Searching rows for update
Finding records that meet the criteria for an update. This must be completed before UPDATE modifies the relevant records.
Sleeping
Waiting for the client to send a new request.
System lock
Waiting to acquire an external system lock. If you are not running multiple mysqld servers requesting the same table, you can disable external system locks by adding the –skip-external-locking parameter.
Upgrading lock
INSERT DELAYED is attempting to obtain a table lock to insert new records.
Updating
Searching for matching records and modifying them.
User Lock
Waiting for GET_LOCK().
Waiting for tables
The thread was notified that the table structure has been altered and needs to reopen the table to get the new structure. To reopen the table, it must wait for all other threads to close this table. This notification occurs under the following conditions: FLUSH TABLES tbl_name, ALTER TABLE, RENAME TABLE, REPAIR TABLE, ANALYZE TABLE, or OPTIMIZE TABLE.
waiting for handler insert
INSERT DELAYED has processed all pending inserts and is waiting for new requests.
Most states correspond to very fast operations. If a thread remains in the same state for several seconds, there might be a problem that needs investigation.
There are other states not listed above, but most are only relevant when checking if the server has errors.
The MySQL manual has descriptions of all states, linked here: http://dev.mysql.com/doc/refman/5.0/en/general-thread-states.html
Chinese explanations sourced from http://www.linuxpk.com/5747.html
When running show processlist while MySQL is busy, you will see many rows of output, each corresponding to a MySQL connection. How do you diagnose which process initiated the connection? And what is it currently doing?
First, you need to connect to MySQL via TCP Socket rather than Unix Socket, so the source port number will appear in the show processlist output. As follows,
mysql> show processlist;
+——–+——–+—————–+——+———+——+——-+——————+
| Id | User | Host | db | Command | Time | State | Info |
+——–+——–+—————–+——+———+——+——-+——————+
| 277801 | mydbuser | localhost:35558 | mydb | Sleep | 1 | | NULL |
| 277804 | mydbuser | localhost:35561 | mydb | Sleep | 1 | | NULL |
| 277805 | mydbuser | localhost:35562 | mydb | Sleep | 0 | | NULL |
+——–+——–+—————–+——+———+——+——-+——————+
In the Host column, there are the source IP and port number. Then we check on the connecting machine which process has opened that port,
[root@localhost ~]# netstat -ntp | grep 35558
… 124.115.0.68:35558 ESTABLISHED 18783/httpd
This reveals that process 18783 initiated the MySQL connection with source port 35558. Then you can observe this process using strace. If it’s a PHP script for Apache, you can also use the proctitle module ( http://pecl.php.net/package/proctitle/ ) to set status information for the script.
lsof can also display the process ID based on the port number; please refer to its manual for details.
http://www.mysqlperformanceblog.com/2007/02/08/debugging-sleeping-connections-with-mysql/