

dstat is a versatile tool that can replace vmstat, iostat, netstat, and ifstat. It overcomes the limitations of those commands and adds extra functionality, increasing the number of monitored items and becoming more flexible. dstat is handy for monitoring system performance, benchmarking, and troubleshooting.
dstat lets you see all system resources in real-time. For example, you can compare disk utilization by aggregating from the current state of IDE controllers, or directly compare disk throughput against network bandwidth figures (over the same time interval).
dstat presents option information in a list format and clearly tells you the scale and units in which output is displayed. This better prevents information confusion and false positives. More importantly, it allows you to easily write plugins to collect the data you want, enabling extensibility like never before.
Dstat’s default output is designed for real-time human viewing, but you can also export the detailed information as CSV to a file and import it into Gnumeric or Excel to generate tables.
Features
- Combines vmstat, iostat, ifstat, netstat, and more information
- Displays statistics in real-time
- Enables monitored items and sorting for analysis and troubleshooting
- Modular design
- Written in Python, making it easier to extend existing workloads
- Easy to extend and add your own counters (please contribute!)
- The many included extensions clearly demonstrate how easy it is to add new monitoring items
- Can group block/network device statistics and provide totals
- Can display the current state per device
- Extremely accurate time precision, with no delay in display even under high system load
- Displays accurate units and limits conversion error range
- Uses different colors to display different units
- Displays intermediate results with less than one second delay
- Supports CSV format report output, which can be imported into Gnumeric and Excel to generate graphs
Installation
For Ubuntu/Mint and Debian systems:
Relevant packages are available in the local software repositories. You can install it with the following command:
- # sudo apt-get install dstat
For RHEL/CentOS and Fedora systems:
You can find the relevant installation package in the RPMforge repository. Refer to the guide and easily install it using the following command:
- # yum install dstat
For ArchLinux systems:
The relevant package is in the community repository. You can install it with this command:
- # pacman -S dstat
Usage
The basic usage of dstat is to simply enter the dstat command, with output as follows:
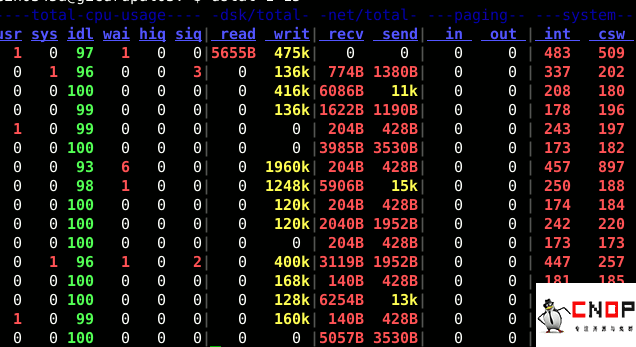
This is the information displayed by default output:
CPU Stats: CPU usage. The more interesting parts of this report show user, system, and idle portions, which better analyze the current state of CPU usage. If you see the “wait” column with a high usage value, it indicates some other system problem. When the CPU state is in “waits”, it is because it is waiting for a response from an I/O device (e.g., memory, disk, or network) and has not yet received it.
Disk Stats: Disk read and write operations. This column shows the total reads and writes of the disk.
Network Stats: Data sent and received by network devices. This column shows the total data received and sent by the network.
Paging Stats: System paging activity. Paging refers to a memory management technique used to find system context. A large amount of paging indicates the system is using a lot of swap space, or that memory is heavily fragmented. In most cases, you want to see the page in and page out values as 0 0.
System Stats: This item shows interrupts (int) and context switches (csw). This statistic is only meaningful when there is a baseline for comparison. High statistical values in this column usually indicate many processes causing congestion, requiring attention to the CPU. Your server is typically running some programs, so this item will usually show some figures.
By default, dstat refreshes data every second. If you want to exit dstat, you can press the “CTRL-C” keys.
Note that the first line of the report usually shows no numerical values for all statistics.
This is because dstat provides a summary based on the previous report, so there is no data for averages and totals on the first run.
However, dstat can be run by passing 2 parameters to control the report interval and the number of reports. For example, if you want dstat to output the default monitoring with a report interval of 3 seconds and output 10 results in the report, you can run the following command:
- dstat 3 10
There are many parameters available in the dstat command, which you can view using the man dstat command. The most commonly used parameters include these:
- -l : Display load statistics
- -m : Display memory usage (including used, buffer, cache, free values)
- -r : Display I/O statistics
- -s : Display swap partition usage
- -t : Display the current time in the first line
- –fs : Display file system statistics (including total number of files and inodes values)
- –nocolor : Do not display colors (useful sometimes)
- –socket : Display network statistics
- –tcp : Display common TCP statistics
- –udp : Display some dynamic data of listening UDP interfaces and their current usage
Of course, the usage is not limited to these. dstat comes with some plugins that greatly extend its functionality. You can check /usr/share/dstat directory to see some of their usage methods. Commonly used ones include these:
- -–disk-util : Display the busy status of a disk at a certain time
- -–freespace : Display current disk space usage
- -–proc-count : Display the number of running programs
- -–top-bio : Point out the process consuming the most block I/O
- -–top-cpu : Graphically display the process consuming the most CPU
- -–top-io : Display the process with the most normal I/O
- -–top-mem : Display the process consuming the most memory
Here are some examples:
Check what is occupying all the memory:
- dstat –g –l –m –s —top–mem
Display some data about the cost of CPU resources:
- dstat –c –y –l —proc–count —top–cpu
How to Output a CSV File
To output a CSV format file for later use, you can use the following command:
- # dstat –output /tmp/sampleoutput.csv -cdn
via: http://linuxaria.com