

RA, the core alerting system of Shenma, handles anomaly alerts for over ten thousand service processes across Shenma Search, Recommendations, Advertising, and other business lines. Its powerful features, simple usage, and stable system performance have earned recognition from a large number of adopters. It has now expanded beyond Shenma and is applied at scale in multiple subsidiaries such as Taobao, UC, and Shuqi. Through several version iterations and long-term production environment testing, the monitoring and alerting system RA is now quite feature-rich. Based on user feedback and actual business needs, the system underwent a major refactoring and was open-sourced on GitHub (https://github.com/alibaba/RedAlert). The open-source version can read core system metrics collected from systems like Ganglia and Graphite and trigger alerts based on configured rules. It can also be extended via plugins to support other time-series data for monitoring and alerting. Its architecture is shown in Figure 1:
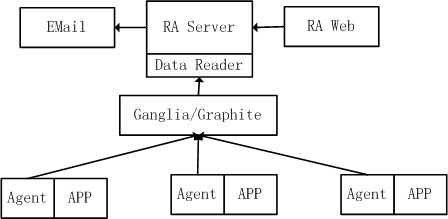
Figure 1: System Framework Diagram
Systems like Ganglia and Graphite collect core metrics from various applications through their respective Agents and then display trend graphs via a visualization interface. However, systems such as Ganglia and Graphite generally only handle collection and display, lacking alerting capabilities when metrics are anomalous. RA directly reads the data collected by Ganglia, Graphite, and similar systems, then detects anomalies based on configured rules and proactively sends alerts. RA consists of two parts: the RA server is responsible for loading alert rules and reading metric data, sending alerts when anomalies are detected. The alert method can be configured as email or extended to other methods. RA Web serves as the user interface, facilitating user configuration of various rules and system control. To facilitate further extension by adopters, the Data Reader part is abstracted into an independent plugin; users can write new plugins to support other types of time-series data.
Users frequently add, delete, and modify monitoring metrics and parameters, so RA provides a visual operation interface for ease of use. The main interface is shown in Figure 2. The RA interface is quite clean, offering operations such as strategy configuration and modification, monitoring item silencing, and RA status control. To quickly find monitoring items, the left-side list bar provides a quick search function, which is extremely useful for systems with hundreds or thousands of monitored applications. A query operation for a monitoring metric is provided in the upper right corner, helping users retrieve monitoring metrics containing specific strings. For a monitoring metric, you can quickly view, modify, delete, and silence it. You can also clone a monitoring metric to quickly create a new one. For more features and usage instructions, please refer to the RA user documentation. 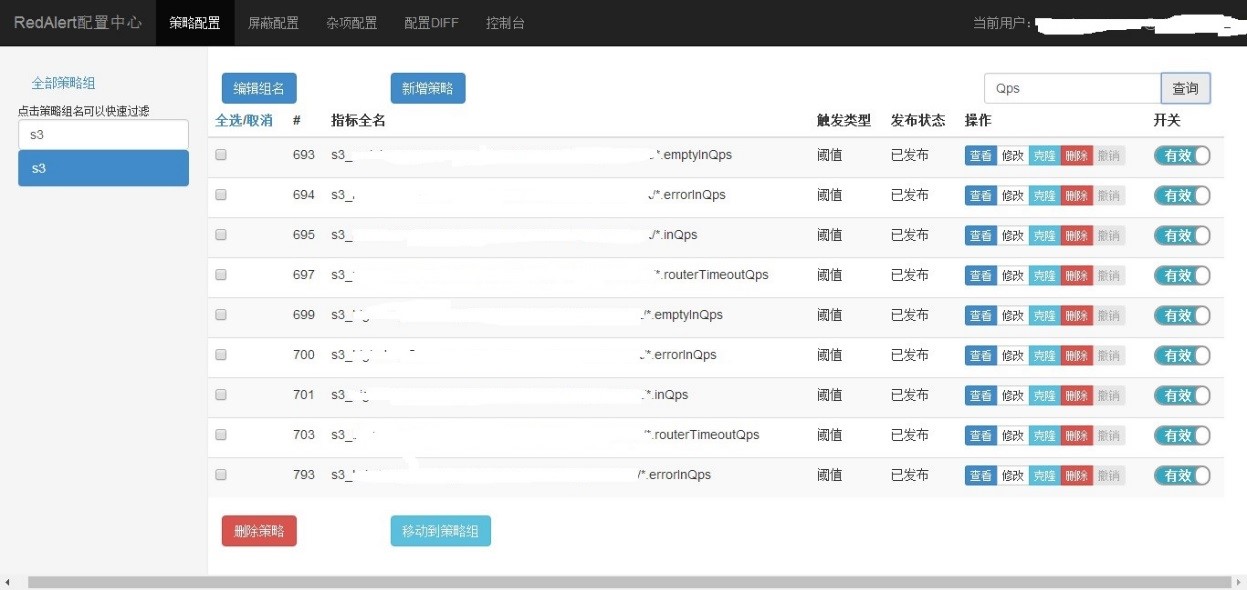
Figure 2: RA User Interface
RA provides five commonly used alert strategies: Threshold, Trend, Period-over-Period, Availability, and Singular Point.
Threshold Detection: Threshold is the most commonly used alert strategy. Typically, a metric fluctuating within a range is normal; exceeding this range is considered anomalous and requires an alert, such as a system’s QPS. For some metrics, the expectation is that the maximum value does not exceed a certain number, or the minimum value does not fall below a certain number, such as CPU or latency. These requirements can all be easily met using the threshold detection strategy.
Trend Detection: Most system metrics form a relatively smooth curve, rarely experiencing cliff-like sudden spikes or drops. If a sudden spike or drop occurs, it is usually indicative of a system anomaly, such as a sudden influx of crawler traffic causing a surge in visits. In such cases, if the threshold alert is too lenient, the anomaly may be difficult to detect. The trend detection strategy is needed to discover these potential issues. The trend detection strategy predicts the next value based on historical data; if the difference between the actual system value and the predicted value is too large, it is considered an anomaly. This strategy can promptly identify potential problems in the system and is also widely used.
Availability Detection: Most systems possess horizontal scaling capabilities, usually provided by multiple nodes with identical functions simultaneously to enhance service capacity. For example, multiple Redis processes form a service cluster to provide data access services. If some machines go down and service processes stop, service availability is affected. RA detects anomalous services by judging the number of machines normally reporting a metric. Availability alerts are triggered by setting the minimum number of processes reporting the same metric; when the count falls below a threshold, the entire service cluster is considered at risk.
Singular Point Detection: In a service cluster, nodes with the same function should have similar metrics; otherwise, there might be an anomalous node. For example, among thousands of nodes in the same cluster, if a few nodes have higher latency than others, those nodes need to be addressed promptly. RA compares the same metrics reported by all nodes, referencing a configured difference range. If the difference exceeds the configured range, it is judged as an anomalous node and an alert is triggered. This is quite effective for discovering hardware damage, such as disk slowdowns, or interference from external processes, such as IO issues.
Periodic Detection: A large number of service metrics exhibit cyclical changes, usually fluctuating regularly with the peak and off-peak external user traffic. For instance, traffic might be relatively high during the day and relatively low late at night. Within a cycle, the period-over-period metric difference should be small. RA detects service anomalies by comparing metric differences at the same time point in adjacent cycles.
For more flexible alert rule configuration, RA allows you to configure the effective time period for a strategy, which can be a single time period or multiple time periods. When configuring the metric names to monitor, the system supports regular expression matching, facilitating the configuration of a series of metric monitors. Different alert items can have different metric sampling intervals, minimum alert intervals, etc., to adjust alert sensitivity and suppress excessive alert messages. Anomaly alerting is an indispensable part of large-scale systems. Across many of Shenma’s business lines, over 99% of anomaly issues are discovered and alerted by RA. After open-sourcing RA, we hope it can benefit more businesses with similar needs, and we also expect RA itself to be further improved.
Related Links:
RedAlert: https://github.com/alibaba/RedAlert
Ganglia: http://ganglia.info/
Graphite: http://graphiteapp.org/